Comet Sublimation Research
In January of 2019, I took part in Massachusetts Institute of Technology's Astronomy Field Camp at Lowell Observatory in Flagstaff, Arizona. Over the course of three weeks, I worked with Lowell astronomer Dr. Michael Mommert to analyze two models for comet sublimation with observational data.
Comets are one type of small body in the solar system. They are distinct from asteroids in their makeup (more ice than rock), in their orbital patterns, and in the spectacular comae that comets exhibit once they get sufficiently close to the sun. The reasons for these tails is well-understood - the heat of the sun causes the ice particles on the exterior of the cometary nuclei to detach in enormous clouds of gas. However, two questions remained that Dr. Mommert and I worked to answer: When do comets start sublimating in their orbits? And, are the models the astronomical community has working?
To answer these questions, I did three things:
- Compiled cometary activity discovery dates
- Calculated comets' distances from the sun when their activity began
- Compared the predictions from different models to the observed data
The data I used came from the Central Bureau for Astronomical Telegrams, an institute dedicated to announcing minor celestial discoveries such as comets and supernovae. Since the early 2000s, the CBAT has published their announcements online as electronic telegrams known as CBETs.
My job was to sift through more than a decade of discoveries to find telegrams that mentioned the discovery of cometary activity on previously inert objects. To do this, I used Python to first isolate the discoveries on the subject of comets, then mine the telegrams for keywords including "apparently asteroidal", "cometary appearance", and even "asteroid". Once the relevant telegrams were identified, I extracted from each one the name of the object it discussed, the name and specifications of the telescope that had made the discovery, and the date of the discovery into a JSON file. Then, I calculated each object's distance from the sun on the date of the discovery of cometary activity by putting the object name and discovery date into the JPL Horizons Database.
I analyzed these results against two models for cometary sublimation. The first, simpler one was proposed in 1979 by Cowan and A'Hearn. It balanced an equation for a given heliocentric distance and temperature.

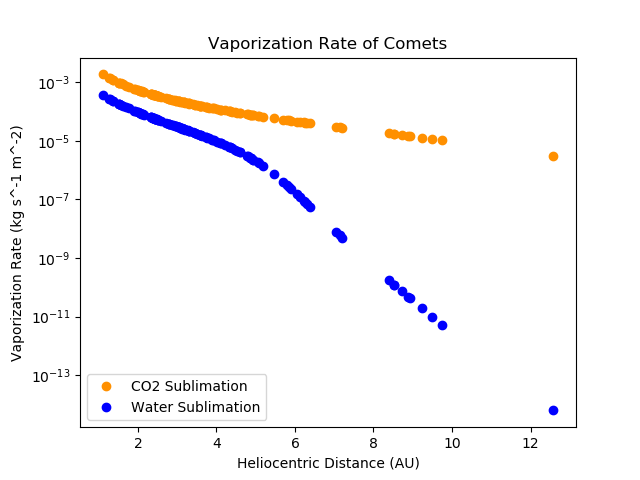
Balancing this equation allowed me to find the vaporization rate of the comets at different temperatures for different substances. This vaporization rate allowed me to calculate the total sublimation of a comet of typical diameter to predict when the activity ought to be visible to an Earth-bound telescope.

Using this model with two different sublimation rates for CO2 and water, the two most common ingredients in comets, I plotted the data as follows.
The second model I analyzed was proposed in 2015 by Bastian Gundlach. Gundlach proposed that two factors kept particles from sublimating off the surfaces of comets: their stickiness, which increases as the particle size decreases, and the gravity of the comet as a whole. These factors, according to the theory, work together such that small comets made of large particles sublimate at the coldest temperatures, the farthest from the sun. As comets get closer, larger comets with smaller particles begin to sublimate.
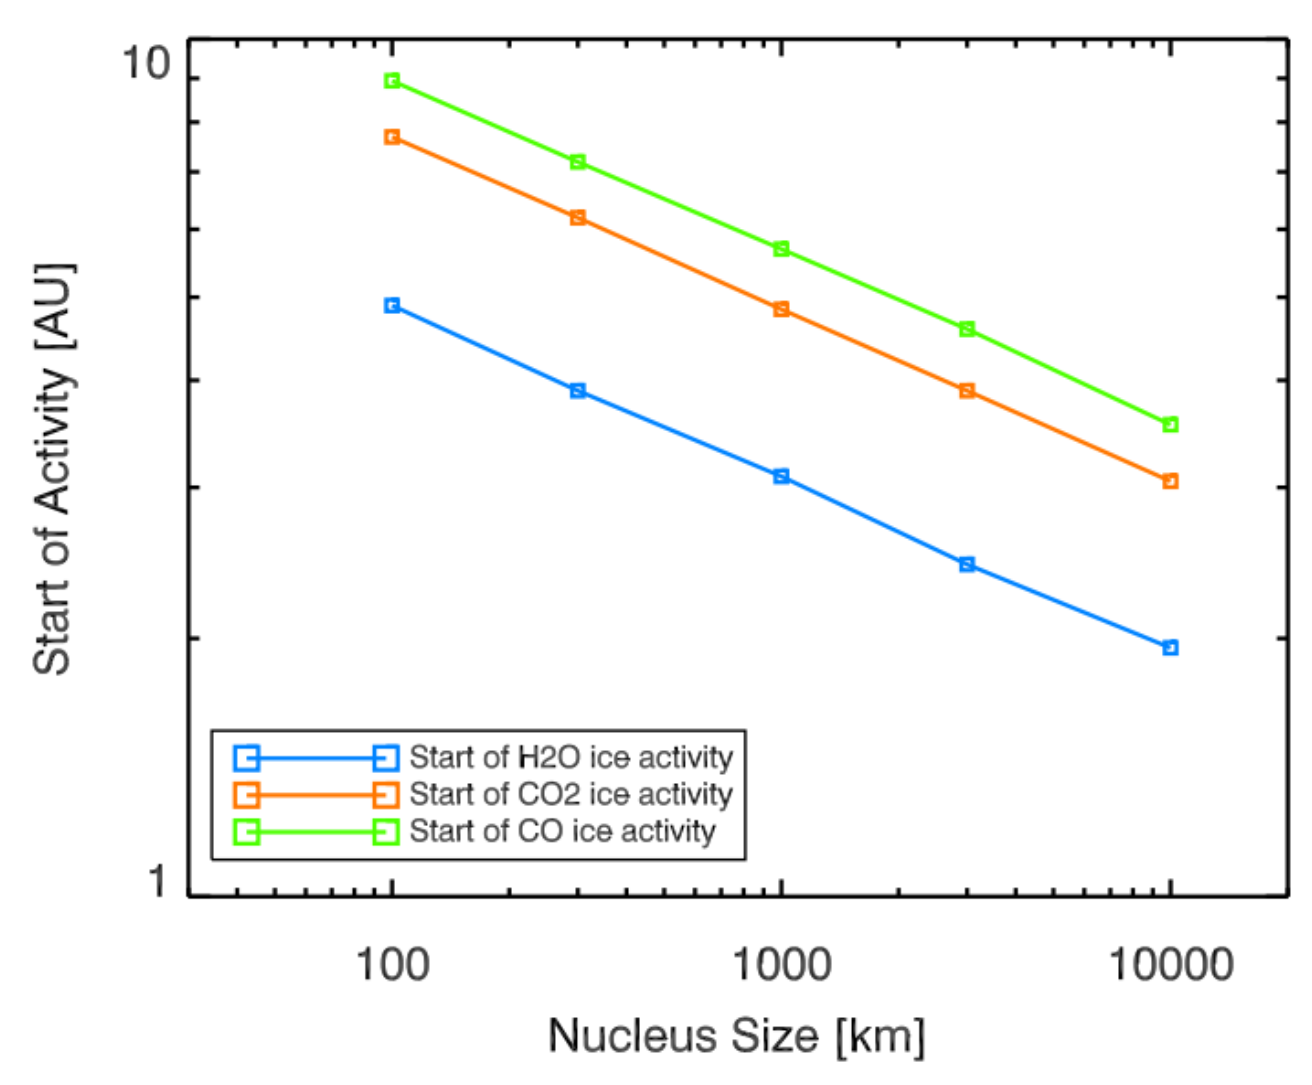
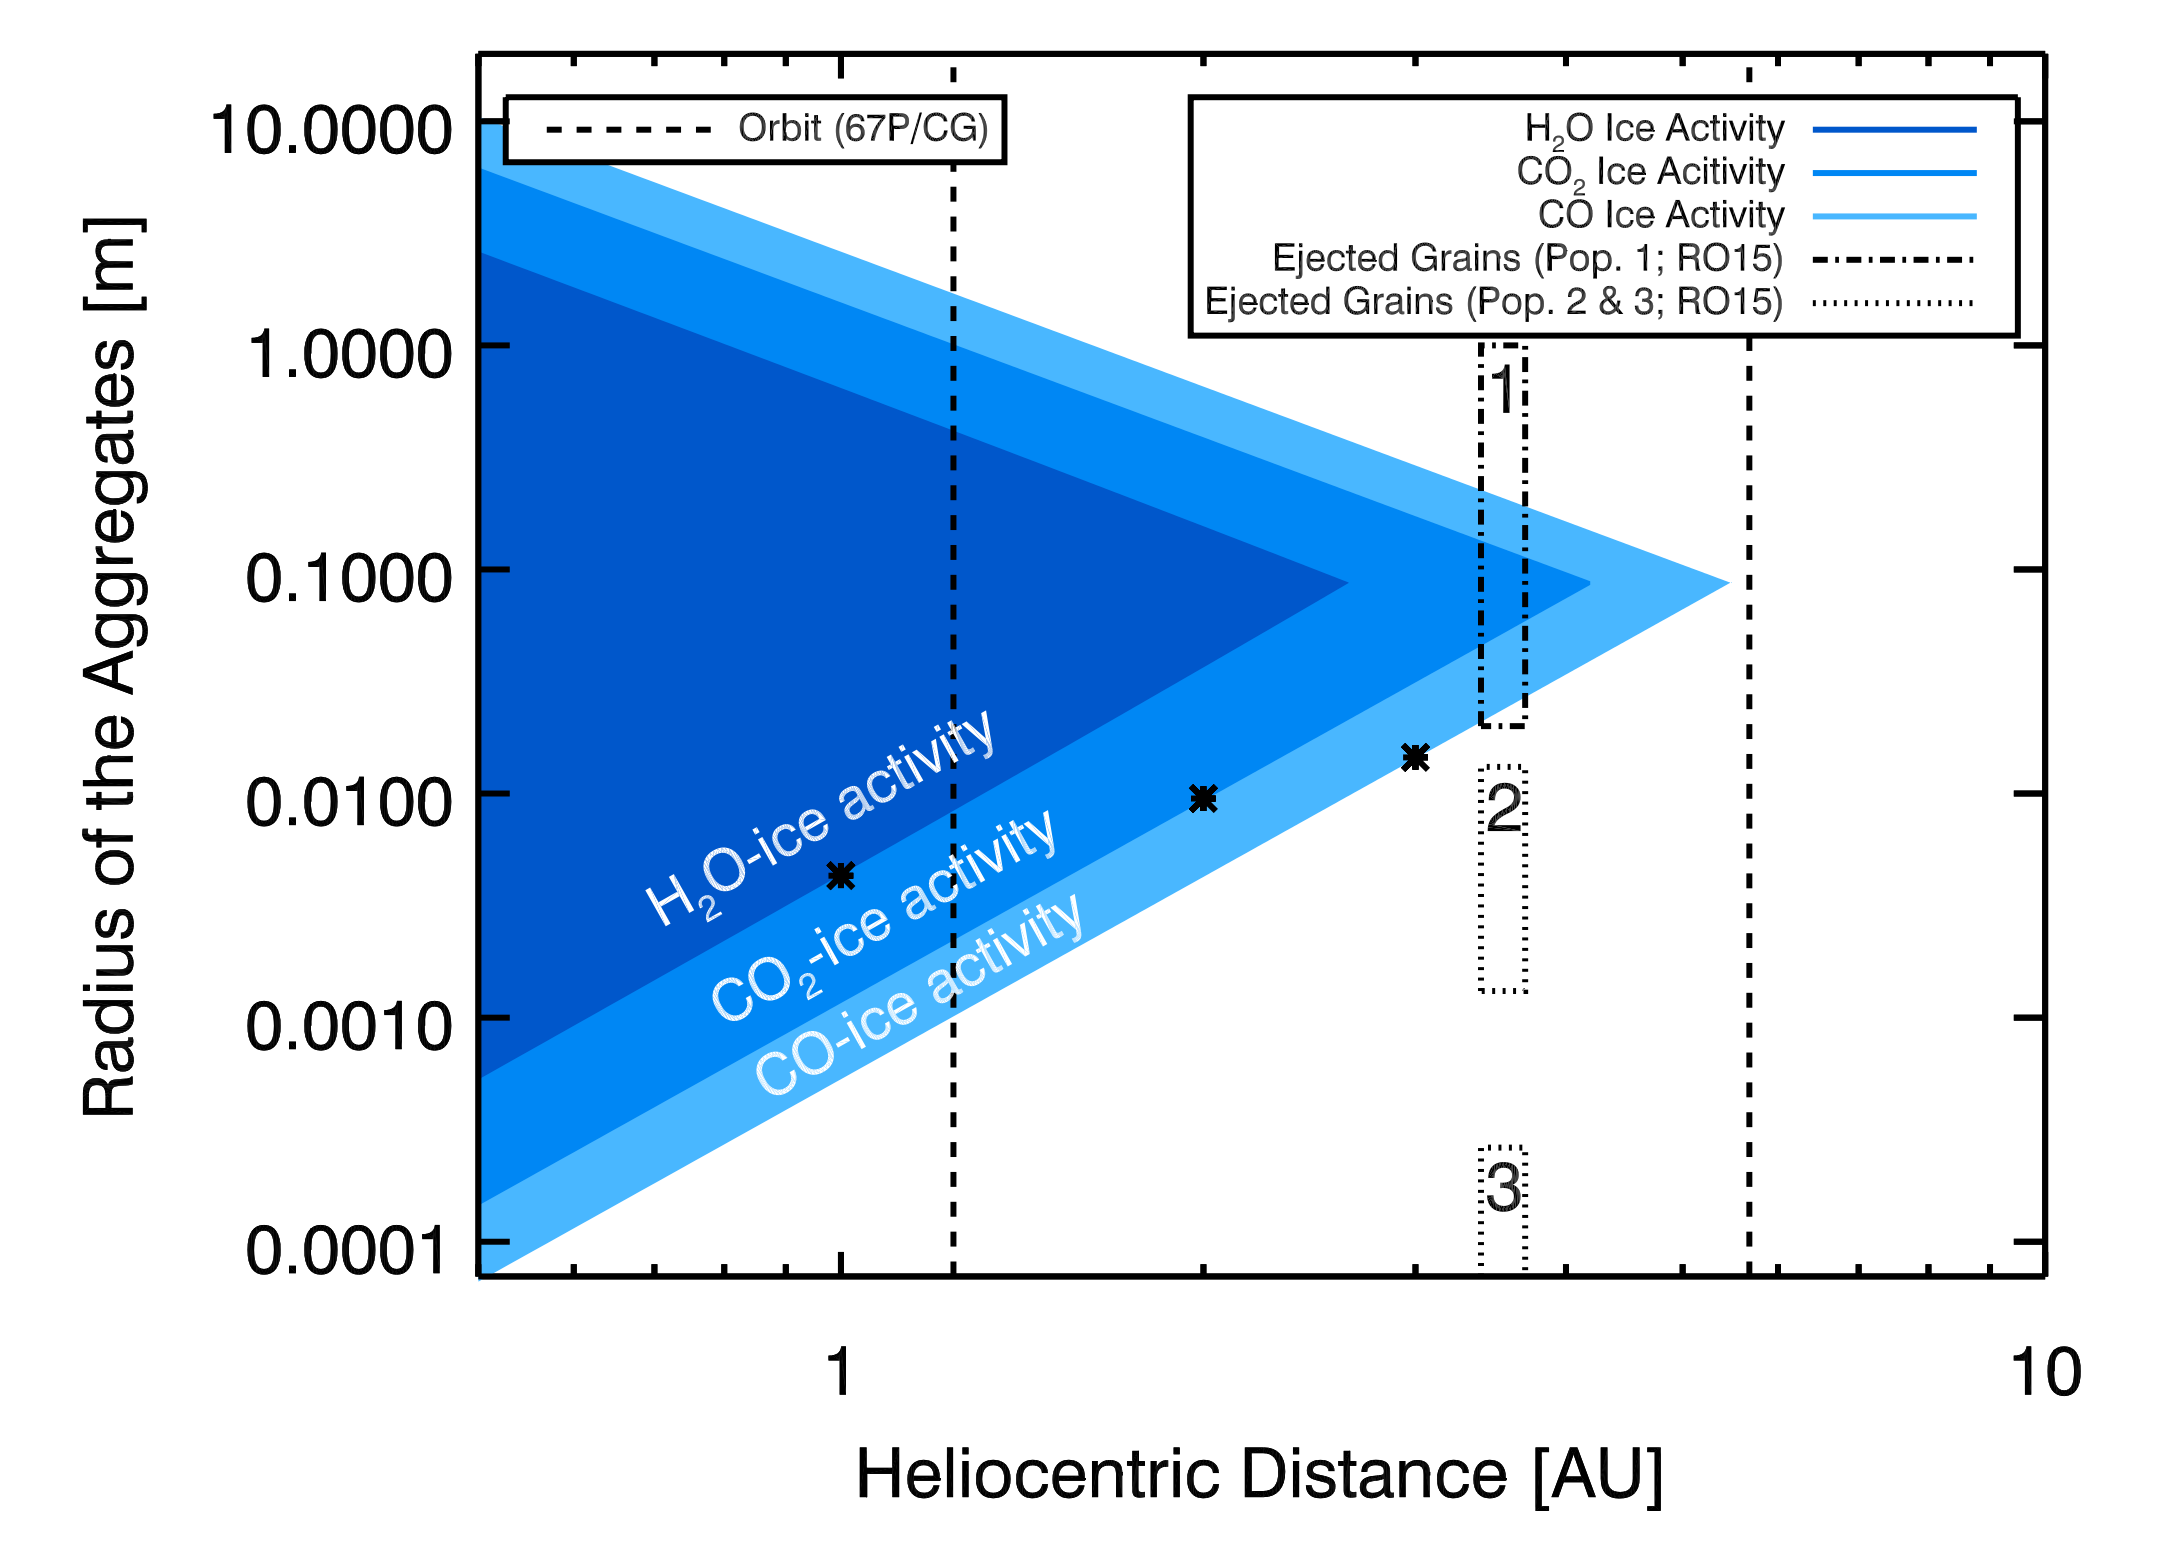
I extended this model to the sizes of the comets actually observed; it should be noted that it's rare for comets to have nuclei more than 100 km in diameter, which is the smallest comet Gundlach directly accounts for in his model.
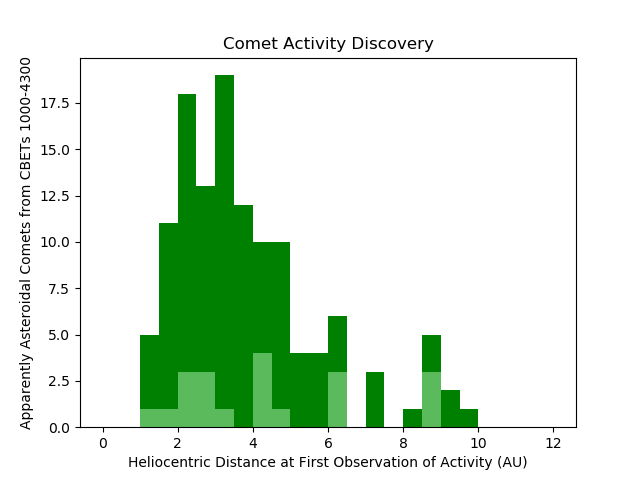
I plotted both model's predictions of where sublimation should start onto the histogram I made from the observational data, shown below.

The dark blue and orange lines are the predictions from Cowan and A'Hearn's model, while the pale blue and orange blocks estimate the areas predicted by the Gundlach model. Neither model could be definitively ruled out by the collected data. One interesting result from the data was that 13 of the 125 cometary activity discoveries could be attributed exclusively to the sublimation of CO2.
When I left the project, there was still more work that could be done to fine-tune the results. Estimating the heliocentric distance of each object at activity discovery involved an approximation of diameter that assumed a constant albedo of .04 and an absolute magnitude taken from the JPL Small Body Database, which is less than perfectly reliable for this kind of measurement. In addition, many of the observations were taken by different telescopes, which can skew the results some; this is why the Pan-STARRS discoveries are highlighted.